
NewRiva · flood and climate checks from satellite data
Know which buildings will flood before you lend, insure or buy.
Riva checks any building or plot in Nigeria from satellite pictures and maps, and answers in plain words: how likely it is to flood, why, and how heat and heavy rain there are expected to change by 2050. We have already checked all 65 million mapped buildings in the country, so we can check any address within days.
What each building gets
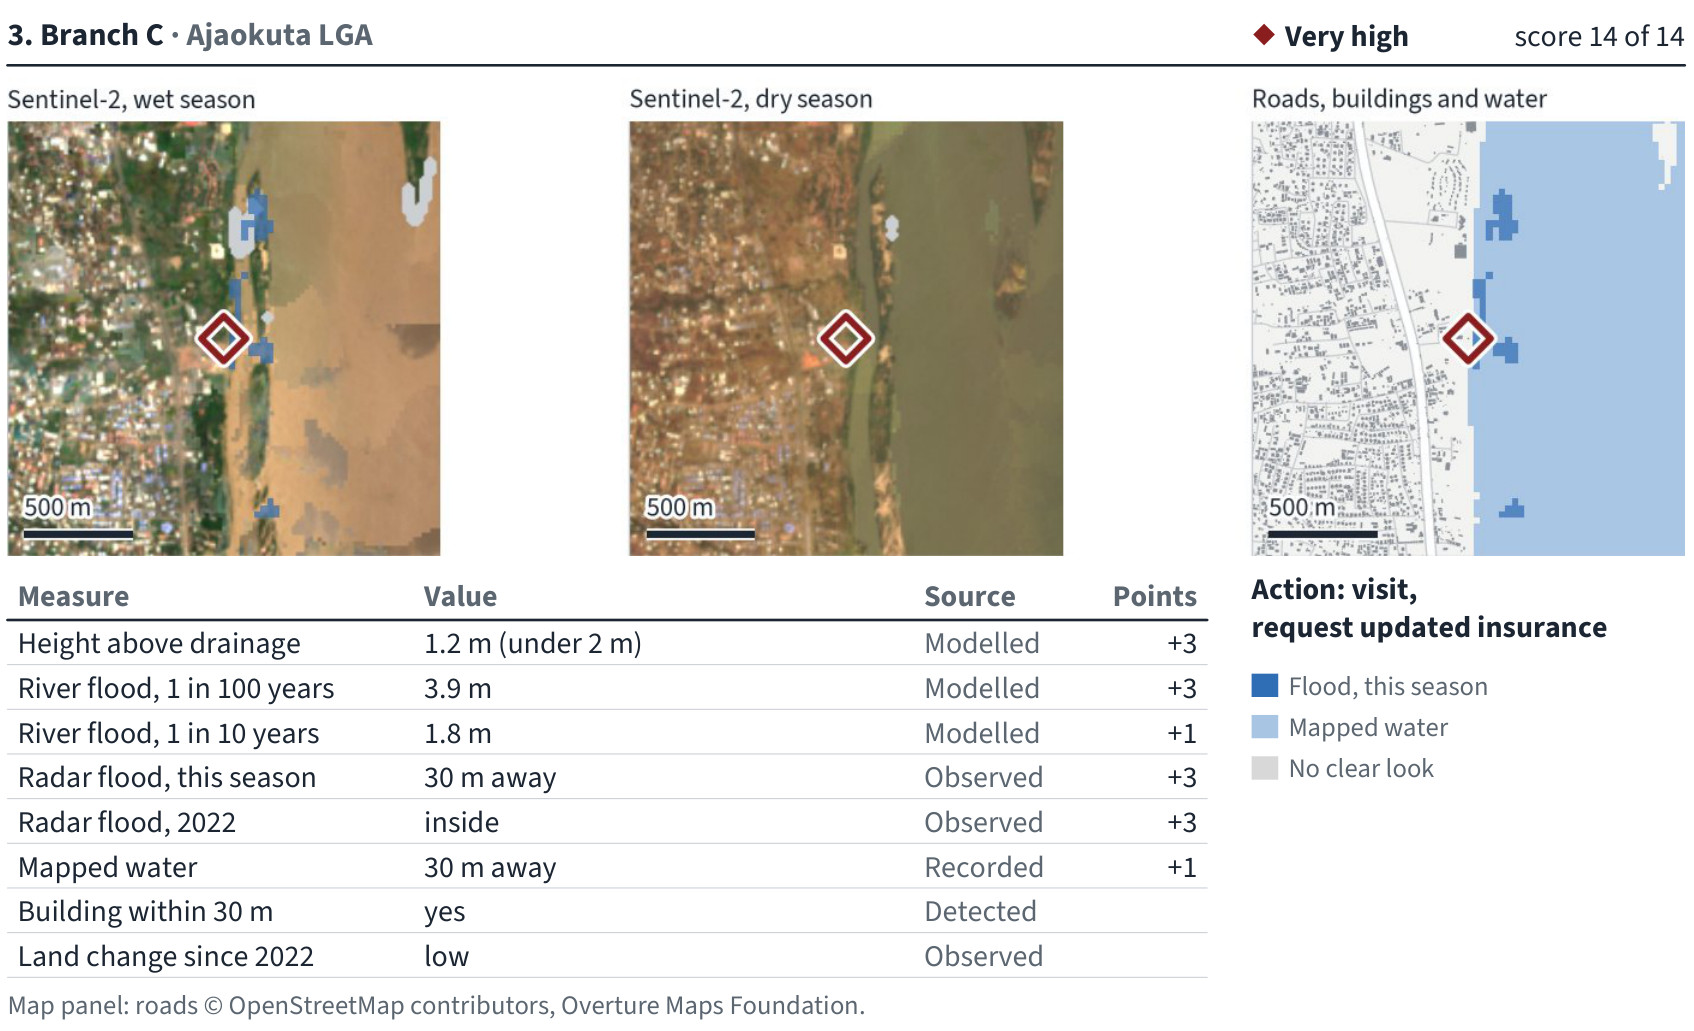
- A flood risk level (Low, Moderate, High or Very high), in plain words, with the reasons
- How high it sits above the nearest stream or drain
- How deep a big river flood would be there, for a 1-in-10-year and a 1-in-100-year flood
- Whether satellites have seen floodwater near it, this season and in 2022
- Heat, drought, heavy rain, water stress and other climate risks for the place, today and by 2050
- What to do next for that building
Some satellites see through rain clouds, so they record floods even in the rainy season. Climate risks come on every check at no extra cost.
All of Nigeria, already checked
65 million buildings
Every mapped building in all 36 states and the FCT, checked for flood.
About 1 in 4 on low ground
16.9 million buildings stand less than 5 m above the nearest drainage channel, where floodwater reaches first. 6.7 million stand less than 2 m above it.
Lagos
All 2.55 million buildings on our map of Lagos checked: about 1 in 4 stand on low ground.
Climate to 2050
Heat, drought, heavy rain and water stress for every place in Nigeria, today and as expected by 2050.
Who it is for
Banks and lenders
Find the branches and collateral on flood-prone ground before the rains do, and the figures the new climate reporting rules ask for.
Insurers
See which buildings on your book are likely to flood, street by street, and price cover on what the ground and the satellites show.
Valuers and surveyors
Add a one-page flood and climate check to each valuation or survey report.
Developers and buyers
Check a plot, an estate or a mini-grid village before you build, and show buyers, with evidence, whether the land floods.
What we found in Port Harcourt
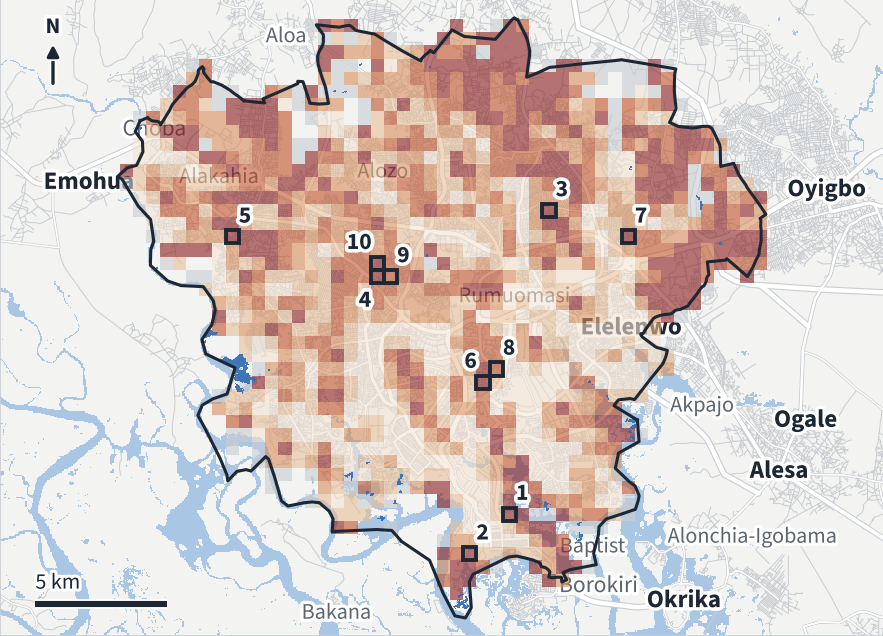
Across Port Harcourt and Obio/Akpor, 56% of the 447,130 buildings we mapped stand on low-lying ground, under 5 m above the nearest drainage channel, and 10% lie inside the modelled 1-in-100-year river flood zone. The darker a square, the higher the share of its buildings on low ground.
Data: contains modified Copernicus Sentinel data 2021 to 2026, Sentinel-1 processed with the Copernicus Data Space Ecosystem; produced using Copernicus WorldDEM-30 © DLR e.V. 2010-2014 and © Airbus Defence and Space GmbH 2014-2018 provided under COPERNICUS by the European Union and ESA, all rights reserved; source EC JRC/Google; JRC river flood hazard maps (© European Union, CC BY 4.0); Global Mangrove Watch (CC BY 4.0); geoBoundaries (source GRID3, CC BY 4.0); Google Open Buildings v3 (CC BY 4.0); © OpenStreetMap contributors (ODbL), Overture Maps Foundation. Sources modified for this screening; CC BY 4.0: creativecommons.org/licenses/by/4.0. The organisations in charge of the Copernicus programme by law or by delegation do not incur any liability for any use of the Copernicus WorldDEM-30.
More checks
Land check
One plot: its flood risk, its climate risks, a satellite picture of it every dry season since 2018, and the buildings on and around it. ₦35,000 a plot. Not a title search or a survey.
Street check
Every building on up to 20 streets or estates you name, ranked by how many stand on low ground. Made for insurers in Lagos's Building Insurance Scheme.
State and area reports
Every mapped building in a state or local government area: which places stand lowest, and where satellites saw floodwater this season.
Power lines, roads and mine sites
A power line or road checked every 500 m for flood, with the stretches to watch first. For mines and large sites, dated satellite pictures each dry season, read by our analyst.
How it works
- 1
Send us the addresses or map points of your buildings or plots. A spreadsheet is fine. No customer names, no account numbers.
- 2
We check each one from satellite pictures and maps.
- 3
You get one page per building in plain words. Larger orders also get a ranked list, an Excel file and a Google Earth file.
Your first check is free, within 48 hours. Full reports in 10 working days.
Prices
- One building₦50,000 for a home, ₦100,000 for a commercial building.
- Lists₦50,000 a building for the first 25, ₦25,000 each from 26 to 200, ₦10,000 each above 200. Minimum order ₦1,000,000.
- Land check₦35,000 a plot.
- Yearly licenceYour whole portfolio kept checked: ₦5 million a year for up to 200 sites, ₦12 million up to 1,000, ₦24 million up to 5,000, ₦48 million up to 20,000. Paid each quarter after that quarter's results. The first quarter is a pilot you can stop, and the price stays fixed for two years.
- First checkFree, within 48 hours.
Climate risks are included at no extra cost. Prices exclude VAT.
Work with us
For surveyors, drone and mapping firms, consultants and brokers who want to offer Riva to their own clients.
- Your first site free, under your own name
- Then buy at 30% off our price and sell at your own price, never below ours
- Or earn 15% of the first year's fees for any client you introduce
Where we work
All 36 states and the FCT. Send any address or map point and we check it within days.
What Riva is not
Riva is a screening, not a survey, a valuation or a title search. It shows which buildings to check first, and we recommend a field check wherever it flags one.
Questions
Is my list safe?
We use it only to check your buildings and never share it. Unless you go ahead, we delete your list and every copy within 30 days. If you need a non-disclosure agreement, send it: our lawyer reviews it and we sign it if appropriate.
Do you visit the building?
No. Everything comes from satellite pictures and public maps, so it is fast and covers many buildings at once. We recommend a field check where Riva flags one.
Is the land check a title search?
No. It shows flood, climate and what satellites have seen on the land over the years. Check the title at the land registry and survey the plot as usual.
Which data do you use?
The European Union's Copernicus satellites (Sentinel-1 radar and Sentinel-2 images), the Copernicus 30 m elevation model, the Joint Research Centre's river flood maps, Google Open Buildings and OpenStreetMap. For climate: CHIRPS rainfall, CHIRTS heat, NASA's NEX-GDDP-CMIP6 climate models and WRI Aqueduct for water.